
Curriculum Impact Reporting Dashboard

After
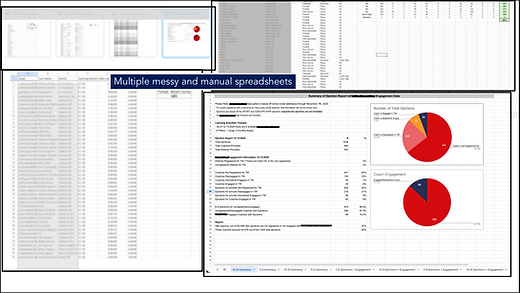
Before
Clients data was spread across multiple locations and multiple formats. Employees were piecing data together manually and presenting unrelaible data to decision makers.
Clients now have an interactive dashboard that pulls reliably from all data sources. Leadership can quickly and clearly see the drivers they need to make important decisions
Objective:
A sports based education company needed to provide leadership with clear, measurable visibility into curriculum effectiveness, learner performance trends, and program outcomes.
The Challenge:
Before working with Olive Data Solutions, the organization faced several reporting and visibility challenges:
Messy Systems
Curriculum and performance data was stored across multiple spreadsheets and systems
Long Manual Hours
Reporting required significant manual preparation and often contained human errors
Unclear Data
Leadership lacked a centralized view of curriculum and learner outcomes
Lacked YoY Trends
Difficulty measuring program effectiveness across different cohorts or time periods
The Goal:
The organization needed a reporting solution that could:
Consolidate curriculum and learner performance data with outcome data
Provide clear visibility into program effectiveness
Reduce manual reporting time and manual input errors
Support data-driven curriculum improvements
The Solution:
Olive Data Solutions developed a fully interactive Curriculum Impact Dashboard designed to transform scattered performance data into actionable insights.
*The schools and districts in this example have been changed and the data displayed is
not intended to be representative of real school districts.
The dashboard solution included:
Data Integration: Consolidated curriculum performance data from multiple internal sources and standardized reporting metrics
Performance Tracking: Visualized learner progress and outcome trends. Enabled filtering by program, cohort, time period, and performance metrics
Reporting Automation: Eliminated manual reporting errors and replaced manual spreadsheet reporting with automated data refreshes
Executive Visibility: Intuitive visuals that required minimal training to use and drove investor meetings
Client Feedback:
"The dashboard provided clear visibility into our curriculum performance and eliminated hours of manual reporting and human errors. Our team can now quickly identify trends and make informed improvements to enhance this program further. Olive Data provided us with an interactive solution that engages our shareholders and helps us paint the picture of effectiveness and need for ongoing and future support of this initiative."
Impact:
Reduced
manual reporting time and errors
Improved
visibility into
curriculum effectiveness
Supported
data-driven curriculum improvements
Increased
confidence in reporting and evaluation